After nine completed races, Kimi Antonelli leads the 2026 F1 Fantasy driver table, Mercedes leads the constructors, and Racing Bulls has delivered the strongest constructor value.
This is a dated mid-season review through the British Grand Prix on July 5, 2026. It uses recorded base fantasy scores and the prices available in BoxBox's July 9 season export. It is not a Belgian GP prediction. For the next team-lock decision, use the live Belgian GP picks and current driver cards.
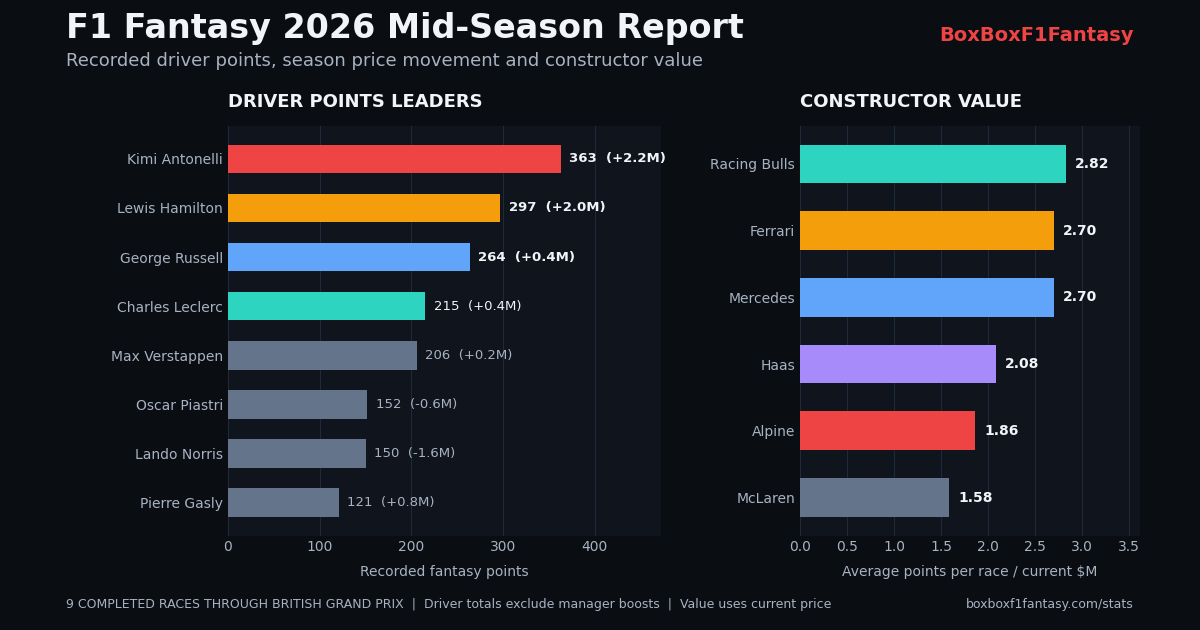
The mid-season picture in six numbers
- 363 points: Kimi Antonelli's leading driver total.
- 38.7 points per race: Lewis Hamilton's average across the latest three completed rounds, the best current driver form.
- +$3.6M: Franco Colapinto's season price rise, the largest among drivers.
- 769 points: Mercedes' leading constructor total.
- 2.82 average PPM: Racing Bulls' recorded points per race divided by its current $11.1M price, the best constructor value.
- +$4.8M: the joint-largest constructor price rise, shared by Racing Bulls and Alpine.
Those numbers describe three different questions. Antonelli has produced the most total points. Hamilton has the strongest recent scoring. Racing Bulls has converted budget into constructor points most efficiently. Treating all three as the same ranking would hide the decisions that matter.
The complete, updateable tables are on the 2026 points and price tracker. This report explains what the snapshot says and where it can mislead.
Kimi Antonelli built the largest points bank
Kimi Antonelli leads the field with 363 recorded fantasy points, 66 ahead of Hamilton and 99 ahead of George Russell. His season average is 40.3 points per race, and his current price of $25.4M still leaves him with the field's best backward-looking average value at 1.59 points per race per million.
The lead was built with a very high ceiling. Antonelli's best round returned 68 points, and only one of his nine scores was negative. That combination of premium scoring and limited outright damage explains why his price has risen $2.2M.
There is an important warning in the recent data. His last three scores are -4, 35 and 23, an 18.0-point average. That is less than half his full-season average. The total leaderboard still rewards his dominant opening stretch, while the recent-form view says the gap has narrowed sharply.
That does not make the season total irrelevant. It means managers should separate points already banked from points likely next weekend. The live prediction model, current practice phase, track fit and risk range belong in the second question.
Lewis Hamilton has been the premium consistency pick
Lewis Hamilton sits second on 297 points, but his distribution is arguably the most manager-friendly among the premium drivers.
Hamilton has not recorded a negative fantasy round through nine completed races. His lowest score is 19, his highest is 56, and his latest three scores are 56, 27 and 33. That recent average of 38.7 leads the field.
His current $24.5M price is also below Antonelli, Russell, Max Verstappen, Lando Norris and Oscar Piastri. With a season average of 33.0 points, that produces 1.35 average PPM. Only Antonelli and the cheaper Liam Lawson have returned more average driver points per current-price million.
The practical appeal is not just the average. A premium asset who avoids negative rounds reduces the need for the rest of the lineup to rescue a bad multiplier choice. That matters when a 2x boost can magnify both upside and disappointment.
George Russell is closing quickly
George Russell is third with 264 points and has also avoided a negative score. His latest three rounds returned 28, 35 and 44, averaging 35.7.
Russell therefore combines a strong season base with improving form. The trade-off is price: at $27.8M he is the second-most expensive driver in the current list and has returned 1.06 average PPM. That is respectable for a premium asset, but it asks the rest of the lineup to find value elsewhere.
The decision between Antonelli, Hamilton and Russell cannot be settled by one column. Antonelli owns the season lead and best full-season average PPM. Hamilton owns the recent-form lead and cleanest scoring floor. Russell owns a strong recent trajectory but costs the most of the three Mercedes/Ferrari options.
The other premium drivers have been more volatile
Charles Leclerc is fourth on 215 points after a 54-point British GP, while Max Verstappen is fifth on 206. Their averages are 23.9 and 22.9 respectively, but both have experienced negative rounds and wider swings than Hamilton.
Verstappen's latest three scores are 22, 43 and -3, averaging 20.7. His price has moved only +$0.2M from the start of the season. That context helps explain why a strong race-specific projection does not automatically make him the season's best-value premium asset.
Oscar Piastri and Lando Norris are sixth and seventh on 152 and 150 points. Both remain expensive at $24.9M and $25.6M, and both have two negative rounds in the recorded history. Norris' latest-three average has recovered to 24.0, but his season price is down $1.6M.
This is where a manager can get into trouble by using reputation as a substitute for price-adjusted evidence. Premium drivers still possess race-winning ceilings. The question is whether the current weekend gives them enough expected upside to justify what their price prevents elsewhere.
The driver price winners were not all premium names
The largest driver price rise belongs to Franco Colapinto, up $3.6M to $9.8M. He has 112 points, a 12.4 season average and a 15.3 average over the latest three rounds. Most importantly for the price story, none of his nine recorded scores is negative.
Colapinto's 1.27 average PPM ranks fourth among drivers. He has not needed premium-level totals to become a valuable asset; repeatable positive scores at a lower starting price did the work.
Esteban Ocon offers an even clearer consistency lesson. His nine scores sit between 7 and 24, with no negative rounds. He has accumulated 110 points, risen $2.1M and returned 1.21 average PPM at his current $10.1M price.
Liam Lawson has produced the strongest non-premium average PPM at 1.40. He is tied with Colapinto on 112 total points, costs $8.9M and is up $1.9M. His path has been less smooth, including one negative round, but the price-adjusted return remains excellent.
These are the assets that change what a complete team can afford. A value driver does not have to outscore Antonelli. He has to return enough points per dollar to unlock the right boosted driver and constructor pairing.
The price fallers show the cost of repeated negative scores
Fernando Alonso has experienced the largest driver price fall at -$4.4M, followed by Lance Stroll at -$3.4M, Nico Hulkenberg at -$3.0M and Alex Albon at -$2.9M.
The fantasy totals explain much of that movement. Alonso is on -10 season points, Hulkenberg on -45, Albon on -1 and Stroll on -76. Stroll has six negative rounds in nine starts.
A lower price can eventually create value, but a price fall alone is not a buying signal. The relevant question is whether the current projection, reliability outlook and scoring route have improved enough to outweigh the reason the asset became cheaper.
Mercedes leads points; Racing Bulls leads value
Mercedes has accumulated 769 constructor points, 145 more than Ferrari on 624. Mercedes averages 85.4 per completed race and has not recorded a negative constructor round.
Ferrari averages 69.3 and costs $25.7M, $6.0M less than Mercedes. That price difference leaves the two almost level on backward-looking average value: 2.70 PPM for Ferrari and 2.70 for Mercedes after rounding.
The standout is Racing Bulls. It has scored 282 points, only sixth in the raw constructor table, but costs $11.1M and averages 31.3 per race. That produces a field-leading 2.82 average PPM. Its price has risen $4.8M, tied with Alpine for the largest constructor gain.
Racing Bulls has also improved recently, averaging 39.7 points across the latest three completed rounds. That is below Mercedes, Ferrari, McLaren and Red Bull in raw recent scoring, but the budget efficiency is difficult to ignore.
Haas ranks fourth on average constructor value at 2.08 PPM, while Alpine sits fifth at 1.86. Alpine has 290 points and the same +$4.8M price gain as Racing Bulls, but now costs $17.3M.
What the constructor table teaches about lineup building
Constructors should not be treated as whatever remains after choosing five drivers. They combine two cars, qualifying teamwork, race scoring and pit-stop points. That can create a more stable points base than concentrating the same budget in one driver.
The season data suggests three valid constructor roles:
- Raw points anchor: Mercedes has supplied the largest total and average.
- Premium efficiency: Ferrari has nearly matched Mercedes' average PPM at a lower price.
- Budget unlock: Racing Bulls has delivered the best average PPM and creates room for premium drivers elsewhere.
The right pairing depends on the complete seven-asset team. This is why the lineup optimizer evaluates combinations rather than ranking every pick in isolation, and why Team Compare is useful when two drafts spend the budget differently.
A practical framework for the second half
The mid-season tables are best used as a baseline, not an autopilot setting.
- Start with the recorded season and recent form. This identifies assets that have repeatedly delivered and those relying on one large score.
- Move to the current race forecast. Circuit fit, practice pace, weather, qualifying expectations and DNF risk can change the order for one weekend.
- Compare complete teams. A slightly weaker individual pick can enable a much stronger constructor pair or boosted driver.
- Separate points from budget strategy. A price-building lineup can rationally sacrifice some immediate expectation if the longer-term budget gain is useful.
- Read the downside range. Historical consistency does not remove current mechanical, weather or incident risk.
For Belgium, that means this report should inform the priors, while the Belgian GP race page supplies the current forecast phase and weather context.
How the numbers were calculated
Driver and constructor totals come from the recorded round-by-round fantasy history after nine completed races. Driver totals are base asset scores and do not include a manager's 2x or 3x multiplier. Current prices and season changes come from the July 9 season summary.
Average PPM in this report means average recorded fantasy points per race divided by the asset's current price. It is intentionally backward-looking. It is not the same as the next-race PPM displayed on prediction cards.
Recent form uses the latest three completed rounds. Cancelled rounds do not count as races. Source data can be inspected in driver_history.json, season_summary.json, and the live points and price tracker. Prediction methods and limitations are documented on the Methodology page.
Bottom line
Antonelli owns the biggest season points bank. Hamilton has supplied the strongest recent form and premium consistency. Colapinto, Ocon and Lawson show how mid-priced drivers can create both points and budget. Mercedes remains the constructor points benchmark, but Racing Bulls has been the most efficient constructor at its current price.
The strongest second-half decisions will come from combining those durable facts with what changes every weekend. Season history tells us who has delivered. The live model, confidence range and team budget tell us whether that asset belongs in the next lineup.